GPAs are weird
The other day in class we were talking about something having to do with weighted averages1. As a familiar example of weighted averages, I had people calculate a weighted GPA for warmup (with weights given by credit hours). While we were discussing this calculation, I mentioned that I think GPAs are wack and we shouldn't use them, but that I wasn't going to get on my soapbox about this. So then a student asked about this on my daily exit quiz:
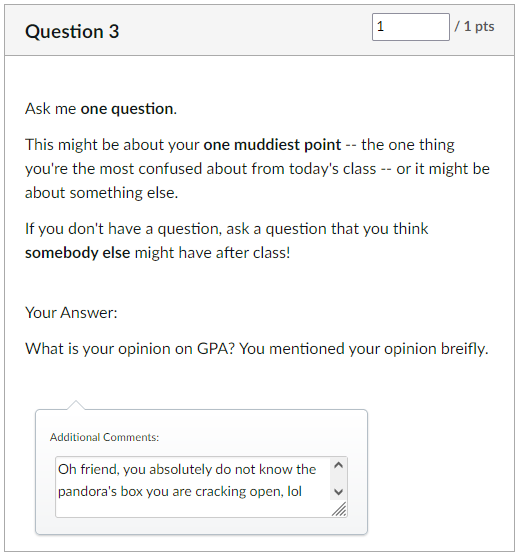
I thought it would be fun to write a blog post digging deeper into something I said in my response to the question. All philosophical disagreements aside (and I have plenty of those), there is a specific mathematical / statistical reason why the GPA calculation is flawed.
Levels of measurement
Probably you have heard in a statistics class or something that statisticians like to separate measures or scales into four levels, each of which is in some way a refinement of the previous:
- A nominal scale just allows you to distinguish between values on the scale.
- An ordinal scale allows you to both distinguish and rank values on the scale.
- An interval scale allows you to distinguish, rank, and subtract values on the scale. (There is a consistent notion of difference between each value on the scale.)
- A ratio scale allows you to distinguish, rank, subtract, and divide values on the scale.
The finer properties your scale has, the more stuff you can sensibly do with it. For instance, it doesn't make sense to sort zip codes into numerical order (they're nominal), but it does make sense to sort runners by their finishing position in a race (finishing positions are ordinal).
Grade points as a scale
This raises a natural question: What level of measurement properly applies to grade points? The “usual”2 way to translate letter grades to grade points is to give whole numbers to each whole letter grade, and then interpolate by thirds3 to give points for plus-minus grades:
| Letter grade | Grade points |
|---|---|
| A | 4 |
| A- | 3.7 |
| B+ | 3.3 |
| B | 3 |
| B- | 2.7 |
| C+ | 2.3 |
| C | 2 |
| C- | 1.7 |
| D+ | 1.3 |
| D | 1 |
| D- | 0.7 |
| F | 0 |
Certainly this is at least a nominal scale (a B is certainly “different” from a C), and it is indeed at least an ordinal scale (a B is certainly “higher” than a C). Just as certainly, I think we have to admit that this is not a ratio scale, because I don't see any sense in which an A (4.0 grade points) is exactly twice as good as a C (2.0 grade points).
So then the only question remaining is, can we think of grade points as an interval scale? That is, is there a consistent notion of difference between the levels on the scale? Well, I can certainly just subtract the grade points assigned to any two levels. The difference between a B (3.0 grade points) and a C (2.0 grade points) is 1.0 grade point, and the difference between an A- (3.7 grade points) and a D+ (1.3 grade points) is 2.4 grade points, etc. etc. So far so good.
But what happens if we look one level deeper by thinking about where the letter grades come from? Specifically, let's think about the “usual”4 percentage-based system for assigning students letter grades within any given course. We start with assigning 90-80-70-60 as the floors for A-B-C-D, then fiddle around to get plus-minus to happen:
| Percentage | Letter grade | Grade points |
|---|---|---|
| 94 - 100 | A | 4 |
| 90 - 93 | A- | 3.7 |
| 87 - 89 | B+ | 3.3 |
| 84 - 86 | B | 3 |
| 80 - 83 | B- | 2.7 |
| 77 - 79 | C+ | 2.3 |
| 74 - 76 | C | 2 |
| 70 - 73 | C- | 1.7 |
| 67 - 69 | D+ | 1.3 |
| 64 - 66 | D | 1 |
| 60 - 63 | D- | 0.7 |
| 0 - 59 | F | 0 |
Now I think we're going to run into some consistency issues. First of all, the fact that ranges of percentages get flattened into letter grades is a consistency problem: the difference in grade points between an A- and a D+ is 2.4 grade points, but it could be anywhere from 27 to 33 percentage points.
Okay, so let's ignore the range issue by just assigning to each letter grade the top end of each range. Still, the differences aren't consistent. The difference between a B and a C is 1.0 grade points and 10 percentage points. But the difference between an A and a B is 1.0 grade points and 14 percentage points – because the percentage ranges are different sizes.
I'm therefore concluding that grade points do not form an interval scale. Sure, I can subtract grade points from each other, because they're all numbers, but the results aren't consistent and thus aren't meaningful. I can say that the difference between my home zip code and my work zip code is 84115 - 84105 = 10, because everything there is a number, but that 10 doesn't mean anything.
What can you do within different levels of measurement?
The interesting thing about levels of measurement is that the properties of each level constrain the mathematical operations you can do with the values you measure.
- Within a nominal scale, you can say that two things are equal or not – that is, you have the operations = and ≠.
- Within an ordinal scale, you get to play with =, ≠, <, and >.
- Within an interval scale, you can add + and - to your toolbox.
- And finally, graduating to a ratio scale, you get * and /.
Let us ponder what operations we need in order to take an average5 of some values. It looks like we need /, but we actually don't, because we're not dividing by a measured value, but instead we're dividing by a count. However, we definitely need +, because we're going to add a bunch of measured values together.
The upshot of this is that averages are only meaningful within interval scales – and grade points are not an interval scale!
The meaningful measure of central tendency within ordinal scales, which grade points are, is the median. This makes sense because all you have to do to figure out the median is to sort, which we can certainly do.
Summary
In order to calculate an average of some values, the values must be on an interval scale. Even if everybody used percentages to calculate letter grades, which isn't the case, and even if everybody did this in the “usual” way, which also isn't the case, the differences between grade points aren't consistent with the differences between percentages, so grade points can't be considered an interval scale. Thus it's not sensible to take averages of grade points.
Extremely tongue-in-cheek conclusion: Replace GPA with GPM.
-
The center of mass of a system of point masses in one dimension. If you don't want to say a bunch of physics words about net torque, you can instead think of this as a weighted average of the locations of the masses with weights given by each mass. ↩
-
Scare quotes because this word is doing some heavy lifting: there are some differences here depending on the particulars of school policy. Some schools like mine allow for a D- with a grade point value of 0.7; others do not. Some schools allow for an A+ with a grade point value of 4.3; others like mine do not. I'm ignoring these subtleties in favor of pointing out a more fundamental problem. ↩
-
Of course we immediately run into an issue that thirds don't have nice decimal equivalents, and we thus round to the nearest tenth; in practice this means that we round up for minus grades and down for plus grades. We run into a similar issue in the percentage table. This is also a problem, but it's not the fundamental one. ↩
-
Even scarier scare quotes here because this word is doing even heavier lifting. Every syllabus author has the prerogative to set their own grading scheme, and lots do, which of course compounds the fundamental problem I'm about to articulate. The scheme I'm choosing to examine here is at least quite common; it is in particular the one built by default into Canvas. ↩
-
Specifically, the arithmetic mean. I don't know anybody who is calculating GPA using the geometric mean, and if I did, I would yell at them. ↩