Logo image

Just Enough Algebra

Section 4.1 Modeling with linear equations

A family with one full-time worker earning minimum wage cannot afford the local fair-market rent for a two-bedroom apartment anywhere in the United States. Even families earning above minimum can struggle to rent an apartment for less than 30% of their income. As a result, many people need affordable housing. There are various local, state, and federally funded programs as well as non-profit agencies working to increase availability.
In our city there are about 64,100 apartments considered affordable. So the city partnered with local developers to build 7,800 more apartments each year. Our variables are
\begin{align*} A \amp= \text{ affordable housing (apartments) } \sim \text{ dep} \\ Y \amp= \text{ time (years from now) } \sim \text{ indep} \end{align*}
Assuming things proceed as planned, after 5 years there would be
\begin{equation*} 64{,}100 \text{ apts } + 5 \text{ years} \ast \frac{7{,}800 \text{ apts}}{\text{year}}=64{,}100+\underline{5} \times 7{,}800 = 103{,}100 \text{ apartments} \end{equation*}
Generalizing, we get our equation
\begin{equation*} 64{,}100+Y\ast 7{,}800 = A \end{equation*}
which can be rewritten as
\begin{equation*} A = 64{,}100 + 7{,}800Y \end{equation*}
This equation fits our template for a linear equation
\begin{equation*} \text{dep }=\text{ start } + \text{slope} \ast {\text{indep}} \end{equation*}
Quick recap. A function is linear if its graph is a straight line, and nonlinear otherwise. The rate of change measures the steepness of the graph for any function, but a straight line is the same steepness everywhere, so the rate of change, or slope of a line is constant. Our example is linear because the slope of apartments per year is constant. Our starting or fixed amount is the intercept. In our example it’s apartments. The dependent variable and the intercept always have the same units - apartments in our example. But
\begin{equation*} \text{units for slope} =\frac{\text{units for dep}}{\text{units for indep}} \end{equation*}
so, in our example slope is measured in apartments per year. These units can help you identify the slope and intercept in a story - so keep a look out.
How many years will it take the city to reach 150,000 apartments at this rate? After ten years, for example, there would still not be enough affordable apartments because
\begin{equation*} A = 64{,}100+7{,}800 \ast 10 = 64{,}100+ 7{,}800\times \underline{10}= 142{,}100 \text{ apartments} \end{equation*}
Continuing successive approximation we get
\(Y\) 0 5 10 11 12
\(A\) 64,100 103,100 142,100 149,900 157,700
vs. 150,000 low low low low high
This city will reach 150,000 affordable apartments within 12 years.
Of course, we could solve a linear equation instead. We want \(A=150{,}000\text{.}\) Using our equation \(A=64{,}100 + 7{,}800 Y\) we get
\begin{equation*} 64{,}100 + 7{,}800Y = 150{,}000 \end{equation*}
However, since we want at least 150,000 affordable apartments, an inequality is even better. Let’s practice that.
\begin{equation*} 64{,}100 + 7{,}800Y \ge 150{,}000 \end{equation*}
Subtract from each side to get
\begin{equation*} \begin{array}{lcr} \phantom{-}\cancel{64{,}100} + 7{,}800 Y \amp \geq \amp 150{,}000 \\ -\cancel{64{,}100} \amp \amp -64{,}100 \end{array} \end{equation*}
which simplifies to
\begin{equation*} 7{,}800Y\ge 85{,}900 \end{equation*}
Divide each side by 7,800 to get
\begin{equation*} \frac{\cancel{7{,}800}~Y}{\cancel{7{,}800}} \ge \frac{85{,}900}{7{,}800} \end{equation*}
which simplifies to
\begin{equation*} Y \ge \frac{85{,}900}{7{,}800} = 85{,}900 \div 7{,}800 = 11.0128205\ldots \end{equation*}
To be sure \(Y \ge 11.0128205\ldots\) we need to round up to get
\begin{equation*} Y \ge 12 \end{equation*}
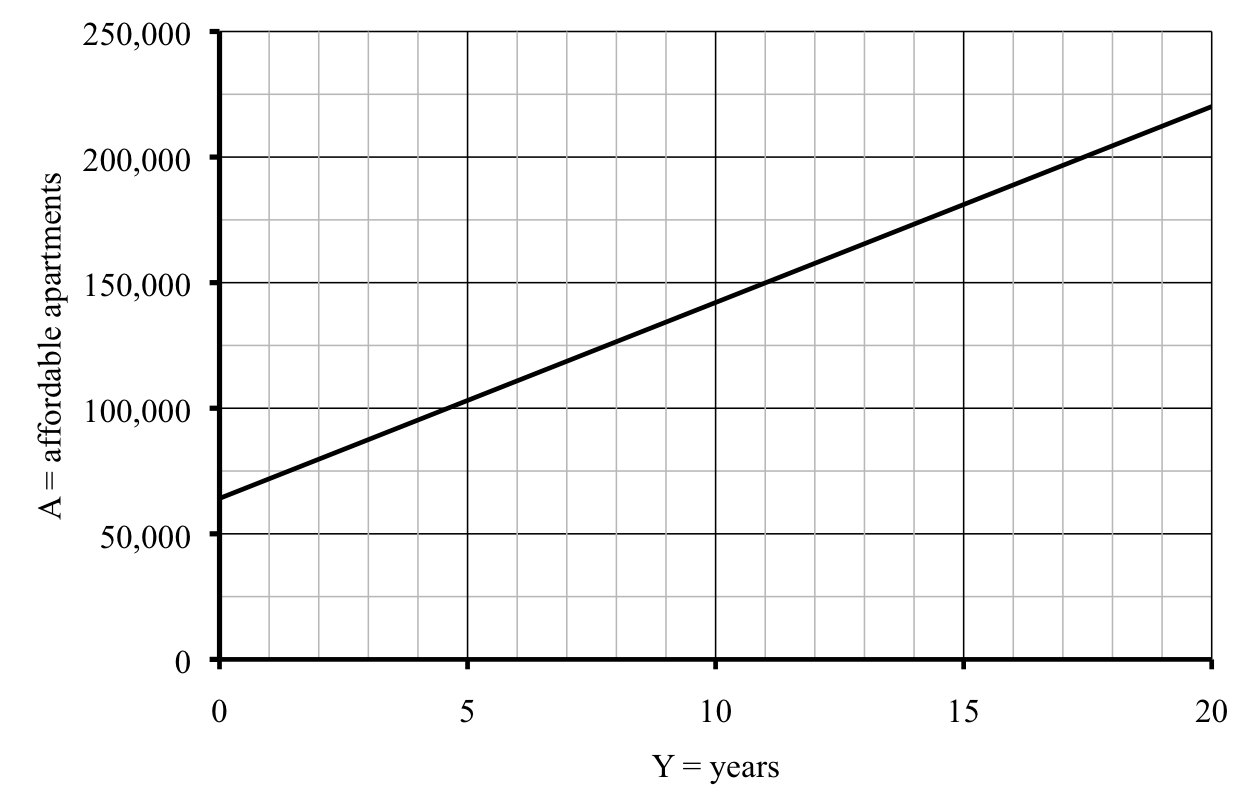
Let’s confirm our findings on the graph.
As expected, the graph is a straight line. And we see that the city should reach its goal of 150,000 affordable apartments in 12 years, or slightly before then.

Do you know …

  1. What makes a function linear?
  2. What the slope of a linear function means in the story and what it tells us about the graph?
  3. What the intercept of a linear function means in the story and what it tells us about the graph?
  4. The template for a linear equation? Ask your instructor if you need to remember the template or if it will be provided during the exam.
  5. How to write a linear equation given the starting amount (intercept) and the rate of change (slope)?
  6. Where the slope and intercept appear in the template of a linear equation?
  7. What the graph of a linear function looks like?
  8. How to solve a linear equation?
  9. Why the rate of change of a linear function is constant?
If you’re not sure, work the rest of exercises and then return to these questions. Or, ask your instructor or a classmate for help.

Exercises Exercises

Exercises 1-4 are available in a separate workbook format.

1.

A solar heating system costs approximately $30,000 to install and $150 per year to run. By comparison, a gas heating system costs approximately $12,000 to install and $700 per year to run. (Story also appears in 4.2.10)
(a)
What is the total cost for installing and running a gas heating system for 30 years?
(b)
Name variables and write a linear equation showing how the total cost for a gas heating system depends on the number of years you run it.
(c)
Name variables and write a linear equation showing how the total cost for a solar heating system depends on the number of years you run it.
(d)
If you install and run a solar heating system, how many years can you use it before it costs the same as installing and running a gas heating system for 30 years (your answer to part (a))? Set up and solve an equation.

2.

Since a very popular e-book reader was released, the price has been decreasing at a constant rate. A blogger developed the following equation representing the price \(E\) of the e-book reader \(T\) months since it was released:
\begin{equation*} E = 359 - 12T \end{equation*}
(a)
Make a table of values for the e-book reader price initially, after 10 months, and after 25 months.
(b)
What does the 359 mean in the story and what are its units?
(c)
What does the 12 mean in the story and what are its units?
(d)
Draw a graph illustrating the dependence.
(e)
After approximately how many months was the price of the e-book reader expected to be down to $200? Set up and solve an equation.
(f)
Sareth decided to purchase a e-book reader when the price fell below $100. How many months after its release did the price of the e-book reader fall below that level? Set up and solve an inequality.
(g)
If you can believe what you read in blogs, the manufacturer will soon be giving away the e-book reader for free, since they make money on the e-book sales themselves. How many months after it was released would that happen, according to our equation? Set up and solve an equation.

3.

Can you tell from the table which of these functions are linear? Use the rate of change to help you decide. Remember that these numbers may have been rounded.
(a)
Savings bonds from grandpa. (Story also appears in 1.2.1 and 5.3.1)
Year 1962 1970 1980 1990 2000 2010
Value bond ($) 200.00 318.77 570.87 1,022.34 1,830.85 3,278.77
(b)
Wind chill at 10°F. (Story also appears in 1.2.2)
Wind (mph) 0 10 20 30 40
Wind chill (°F) 10 -4 -9 -12 -15
(c)
Pizza. (Story also appears in 0.6.2, 2.4.1, and 3.3.1)
Size (inches) 8 14 16
People 1 3 4
(d)
Water in the reservoir. (Story also appears in 2.1.2 and 3.2 Exercises)
Week 1 5 10 20
Depth (feet) 45.5 39.5 32 17

4.

Plumbers are really expensive, so I have been comparing prices. James charges $50 to show up plus $120 per hour. Jo is just getting started in the business. She charges $45 to show up plus $55 per hour. Mario advertises “no trip charge” but his hourly rate is $90 per hour. Not to be outdone, Luigi offers to unclog any drain for $150, no matter how long it takes. For each plumber, the table lists the corresponding equation and several points. In each equation, the plumber charges $\(P\) for \(T\) hours of work. (Story also appears in 2.1.5)
Plumber James Jo Mario Luigi
Equation \(P=50+120T\) \(P=45+55T\) \(P=90T\) \(P=150\)
0 hours $50 $45 $0 $150
2 hours $290 $155 $180 $150
4 hours $530 $265 $360 $150
(a)
Use the points given to plot each of the four lines on the same set of axes. Label each line with the plumber’s name.
(b)
What do you notice about Luigi’s line?
(c)
List the plumbers in order from steepest to least steep line. What does that mean in terms of the story?
(d)
Now list the plumbers in order from smallest to largest intercept of their line. What does that mean in terms of the story?

5.

We looked at the city’s plan to increase the number of affordable apartments. From a current estimate of 64,100 apartments classified as “affordable,” they hoped to build 7,800 per year. At that rate, they can reach a total of 150,000 apartments in 12 years.
(a)
Things change. Revised estimates call for only 6,200 new apartments each year. At that rate, when will the city reach the 150,000 apartments goal? Using the same variables as in this section, set up and solve an equation.
(b)
More bad news. The definition of “affordable” has changed again, so the new count shows only 48,700 apartments on the list. And still only 6,200 new apartments each year. Now when will the city reach the 150,000 apartments goal? Set up and solve an equation.
(c)
In light of the new definition and, consequently, only 48,700 apartments currently on the list, the city has received additional funding to up the number of apartments built each year. They would like to return to their goal of having 150,000 affordable apartments in 12 years. How many apartments do they need to add each year to reach that goal? Figure out the answer however you like, but check that it works.

6.

At a local state university, the tuition each student pays is based on the number of credit hours that student takes plus fees. The university charges $870 per credit hour plus a $560 fee. The fee is paid once regardless of how many credits are taken.
(a)
Name the variables and write an equation relating them.
(b)
Find the slope and intercept for the state university and explain what each means in terms of the story.
(c)
Make a table of values showing the tuition cost at the state university for 3 credits, 12 credits, or 16 credits.
(d)
At the local community college, the tuition each student pays is based only on the number of credits. The college charges $415 per credit.
Using the same variables as before, write an equation relating them for the community college.
(e)
Find the slope and intercept for the community college and explain what each means in terms of the story.
(f)
Make a table of values showing the tuition cost at the community college for 3 credits, 12 credits, or 16 credits.
(g)
Graph both functions on the same axes.
(h)
What do you notice about the graph that confirms the community college is always cheaper?

7.

Can you tell from the table which of these functions is linear? Use the rate of change to help you decide. Remember that numbers may have been rounded.
(a)
Ahmed’s virburnum shrub. (Story also appears in 4.2.3)
Week 0 6 10 18
Height (inches) 16.9 19.3 20.9 24.1
(b)
Rose gold (Story also appears in 0.7.4, 0.4.2, and 2.3.2)
Grams of gold added 0 0.4 0.8 1.4 1.6
Percent gold in alloy 50.0 58.3 64.3 70.6 72.2
(c)
Sea-ice (in millions of square miles)
Year 1980 1990 2000 2012
Sea-ice 3.10 2.66 2.23 1.70
(d)
Wild rice (Story also appears in 4.5.6)
Hint: rewrite the table in order by temperature first.
Temperature (°F) 39 42 41 35 47 45
Acres 2,300 1,950 1,425 2,015 1,233 1,256

8.

The temperature in Minneapolis was 40 degrees at noon yesterday but it dropped 3 degrees an hour in the afternoon. Earlier we found the temperature, \(T\) in °F depends on the time, \(H\) hours after noon according to the equation
\begin{equation*} T=40-3H \end{equation*}
(Story also appears in 1.1.6 and 1.2.7)
(a)
When does the temperature drop below freezing (32°F)? Set up and solve the relevant inequality. Report your answer as an actual time (to the minute).
(b)
When does the temperature drop below zero (0°F)? Same instructions.

9.

Shanille is collecting rare books. She inherited 382 books and buys another 3 books every month.
(a)
Make a table showing the number of rare books in Shanille’s collection at the start, after 1 month, after 12 months, and after 3 years.
(b)
Name the variables and write an equation relating them.
(c)
Solve your equation to determine when Shanille will reach her goal of 1,000 rare books.
(d)
Graph and check.